Transforming Excel Workflows with Microsoft Copilot
Microsoft Copilot continues to revolutionize workplace efficiency by integrating AI-driven automation into everyday tasks. The latest release brings exciting new features to Excel, enhancing how users interact with their data and make informed decisions.
From Images to Insights: Copilot’s New Visual and Formula Intelligence Features
One of the standout features is the ability to ask Copilot to extract insights from inserted images on Windows. By simply inserting an image into the prompt area, Copilot can break down details and trends, transforming visual data into actionable insights. This feature allows users to make quick, informed decisions based on the data extracted from images.
Understanding complex formulas has never been easier with the new Formula Explain feature available on the web. Users can trigger step-by-step explanations directly from the grid, where Copilot breaks down calculations and clarifies references. This feature builds confidence in working with data by providing clear and concise explanations of intricate formulas.
Seamless Data Insights: Copilot Chat Now Understands Your Images
Another powerful addition is the ability to paste images into Copilot chat on both web and Windows platforms. Users can ask questions about the images they insert into the prompt area, allowing Copilot to extract key data for their spreadsheets. This seamless integration of visual data into Copilot chat enhances the overall data analysis experience.
After finalizing data with Clean Data, users can effortlessly switch to Copilot chat for deeper insights and analysis. This seamless transition ensures that users can continue their data exploration and decision-making process without any interruptions.
Smarter Insights, Simpler Prompts: Copilot Brings Charts, Python & Voice to Life
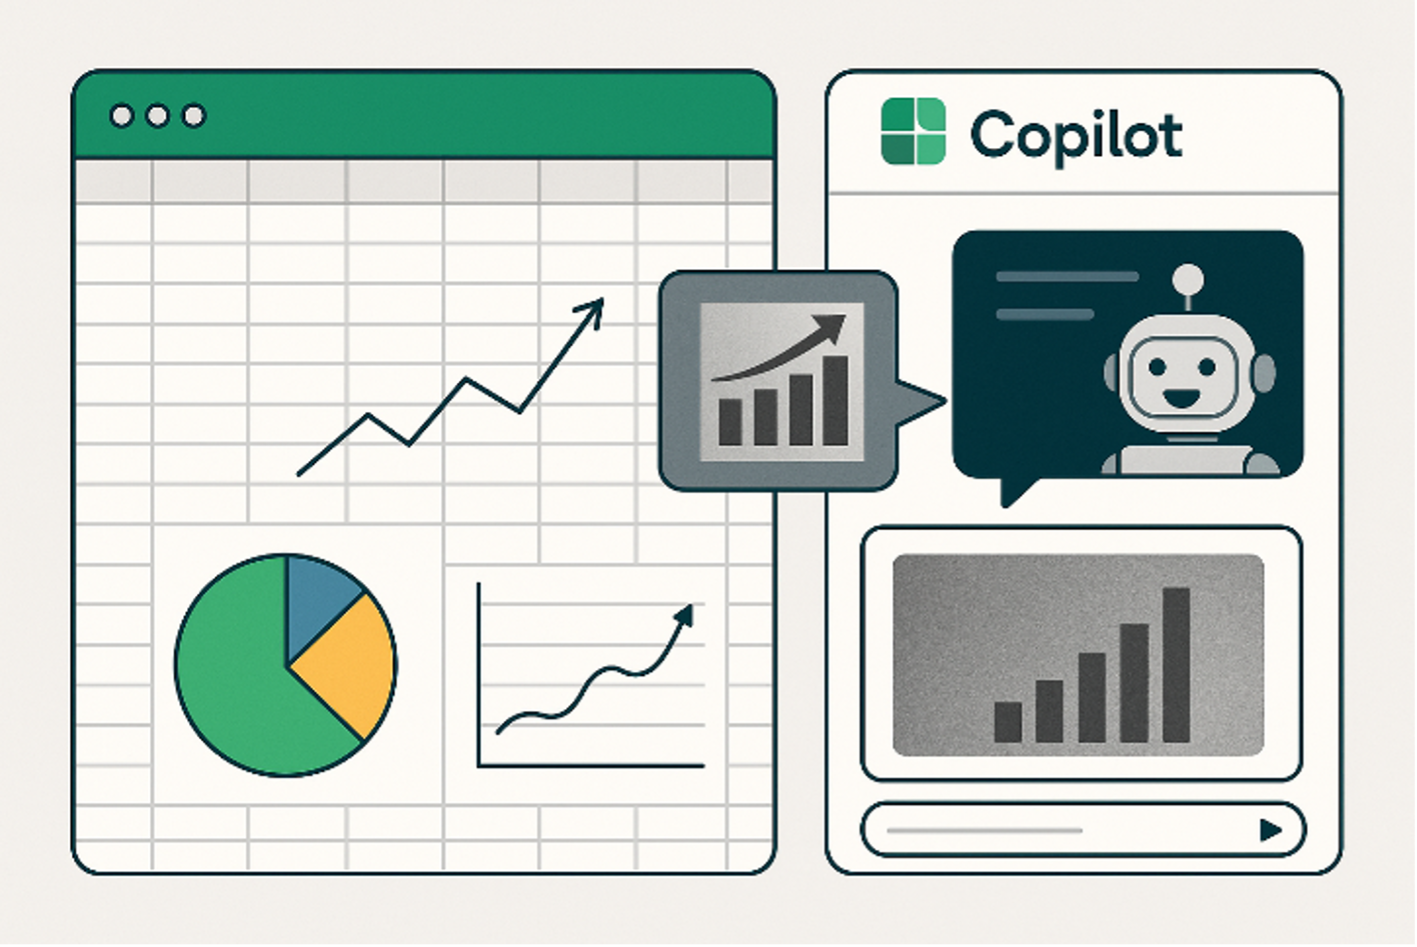
With the latest updates, Copilot makes it easier than ever to generate charts and graphs using simple prompts. Users can create visual representations of their data, such as pie charts and line charts, to better understand trends and relationships. For example, you can ask Copilot to create a pie chart showing the market share of smartphones in the United States or a line chart showing the relationship between inflation rates and interest rates over the last 20 years.
Copilot in Excel now supports advanced analysis with Python, enabling users to gain deeper insights without needing to be Python experts. This integration allows for powerful data analysis and visualization, making it easier to uncover trends and patterns in your data.
Copilot now also offers audio narration, allowing users to hear responses out loud by selecting the speaker icon from the response. Additionally, users can turn spoken ideas into structured documents effortlessly by narrating their thoughts, which Copilot captures and organizes into polished documents.
Unlock Smarter Workflows with TD SYNNEX & Microsoft Copilot
At TD SYNNEX, we are committed to helping businesses leverage these new Copilot functionalities to boost efficiency, improve accuracy, and foster innovation. By integrating these AI-powered features into your Excel workflows, you can transform how you interact with data and make more informed decisions.
Stay ahead of the curve with TD SYNNEX & Microsoft Copilot and unlock the full potential of your data-driven workflows.
If you have more questions or
need help